Reionization
Figures
From Loeb
and Barkana ARAA 2001
From Fan,
Carilli, and Keating ARAA 2006
- Figure 3: Evolution of optical depth with
combined Lyα and Lyβ results. The dash line is for a redshift
evolution of τGP
 (1 + z)4.3.
At z > 5.5, the best-fit evolution has τGP (1 > z)>10.9,
indicating an accelerated evolution. The large open symbols with error
bars are the average and standard deviation of optical depth at each
redshift. The sample variance also increases rapidly with redshift.
(1 + z)4.3.
At z > 5.5, the best-fit evolution has τGP (1 > z)>10.9,
indicating an accelerated evolution. The large open symbols with error
bars are the average and standard deviation of optical depth at each
redshift. The sample variance also increases rapidly with redshift.
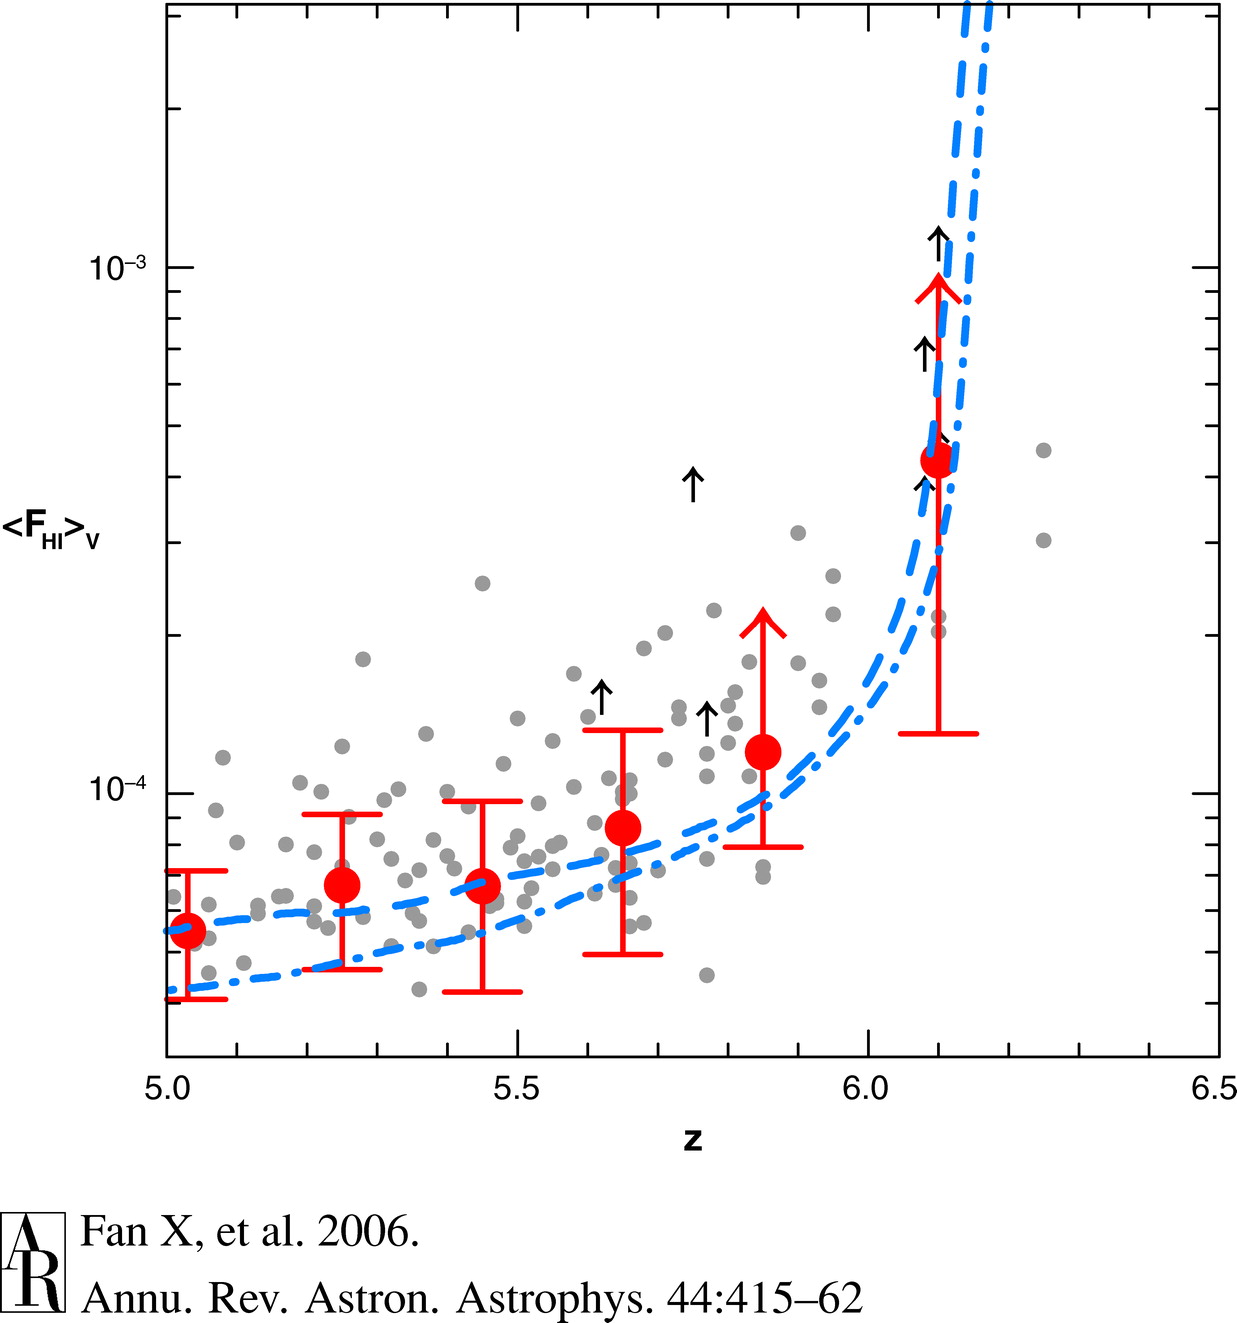
- Figure 6: Evolution of volume-averaged
neutral hydrogen fraction of the IGM. The
solid points with error bars are measurements based on the 19
high-redshift quasars. The dashed and dashed-dotted-dashed lines are
volume-averaged results from the A4 and A8 simulations of Gnedin
(2004).
The neutral fraction inferred from the observations is comparable to
the transition from overlap stage to postoverlap stage of reionization
in simulations (Gnedin 2000).
 103) and the
horizon of current observations (z
103) and the
horizon of current observations (z  2
to 6.3 using Keck/ESI and HIRES data. Large open red squares are
points
data for possible BAL quasars. Flux was computed in bins of 15 Å.
2
to 6.3 using Keck/ESI and HIRES data. Large open red squares are
points
data for possible BAL quasars. Flux was computed in bins of 15 Å.